Inflation Forecasting - The Power of Breakevens 06.23.23
Breakeven inflation rates are a powerful tool. They’re completely inaccurate, they do not work as intended, and it's much easier for inflation to run hotter than forecasted with the Fed’s finger on the unlimited QE button. We still use them and here's why: Eve

Breakeven inflation rates are a powerful tool.
They’re completely inaccurate, they do not work as intended, and it's much easier for inflation to run hotter than forecasted with the Fed’s finger on the unlimited QE button.
We still use them and here's why:
Every investment comes with a hidden cost that unites them all. Whether it's the expense fees of certain ETFs or the higher taxes on income from specific funds, there's one thing they all have in common: the sneaky impact of inflation. It's a crucial factor in investing, yet predicting it is nearly impossible. Still, as active participants in the market, we're constantly challenged to make these predictions and understand how they can inform our investment strategies.
Let's talk about inflation and why we make an effort to consider it when assessing investment returns. Imagine this scenario: you decide to invest in SPY and hold onto it for a solid 10 years. During that time, SPY delivers an average annual return of 10%, taking into account all the fees and expenses involved. As an investor, you're probably feeling pretty good about it. But here's the catch: if the purchasing power of the dollar decreases by 10% each year over those 10 years, your gains don't actually mean much because the value of your invested funds hasn't increased in real terms. Inflation essentially eats away at the purchasing power of your returns, leaving you with no substantial growth. It's important to keep this hidden impact in mind when evaluating your investments.
In this hypothetical situation where both returns and inflation average out at 10%, it might be alarming to realize that your "real" return would be zero. But don't panic just yet! The good news is that, in general, the U.S. stock market has been quite effective at delivering positive long-term returns, even when accounting for inflation. This means that, over time, your purchasing power tends to increase. The bond investors on the other hand pay close attention to long-term inflation trends and expectations. This is because they’re buying an asset with a fixed coupon. They want to make informed decisions that can protect and grow their investments in the face of changing economic conditions.
The real puzzle here is trying to forecast the inflation rate for the long term, which is commonly known as the breakeven rate. The tricky part is that we can't actually know what that rate will turn out to be until after it has already happened. There are different ways to interpret breakevens, such as looking at surveys of consumers, businesses, financial experts, or market-based expectations using TIPS (Treasury Inflation-Protected Securities). However, for our discussion, let's focus on TIPS because they offer the unique advantage of allowing you to take a position alongside them. This means you can actively engage and align your investments with these market-based inflation expectations.
TIPS stand apart from regular treasury securities because they provide unique protection against both inflation and deflation. That's why they're called inflation protection securities, but this valuable safeguard comes at a price. We refer to this price as the "breakeven rate," which represents the inflation rate that needs to be reached or surpassed in order for TIPS to be a worthwhile investment.
When you invest in TIPS, you're essentially buying a modified version of a treasury security. Let's take a 5-year TIPS as an example to understand it better.
Currently, 5-year TIPS are offering a yield of 1.89%. This yield is what we call the "real yield," and it's calculated by subtracting the 5-year breakeven rate (2.15%) from the nominal 5-year Treasury yield (4.04%). So, essentially, the real yield, in this case, is 1.89%.
When you decide to invest in TIPS, it's like placing a bet that inflation will either meet or exceed the breakeven rate throughout the entire 5-year holding period. The interesting thing about TIPS is that while the real yield remains constant over time, the principal value adjusts based on changes in the inflation rate.
Let's consider a couple of scenarios to understand this better. If inflation turns out to be 0% during the holding period, the nominal treasury would provide a realized yield of 4.04%, while your TIPS investment would yield a real return of 1.89%.
Now, imagine if inflation averaged twice the breakeven rate, let's say 4.30%. In that case, the nominal treasury would actually result in a negative real yield of -0.26%. However, your TIPS investment would give you a yield of 1.89% plus the compounded appreciation from inflation.
It's worth noting that when inflation is already high, nominal bonds tend to perform better than TIPS, and vice versa when inflation is lower. So, understanding the inflation environment is crucial when making decisions between TIPS and nominal bonds.
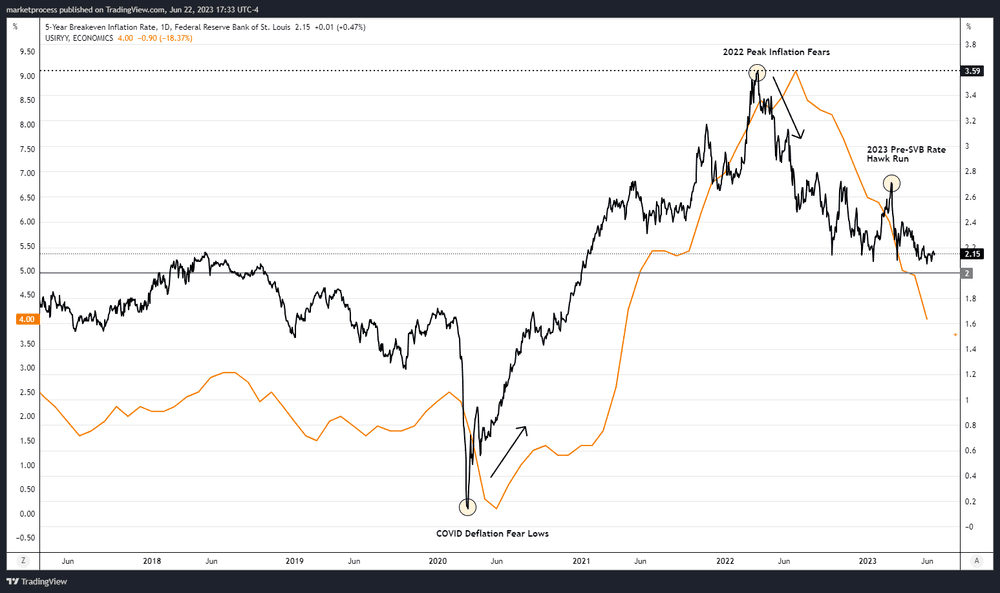
Now that you have a good understanding of TIPS, let's focus on the most important aspect: the breakeven rate. This is basically the market's expectation for the average inflation rate over the next 5 years. To get a clearer picture, let's take a look at a historical chart that compares the forecasted breakeven rates for 5 years with the actual average inflation rates. It's an interesting way to see how well the market's predictions align with reality.
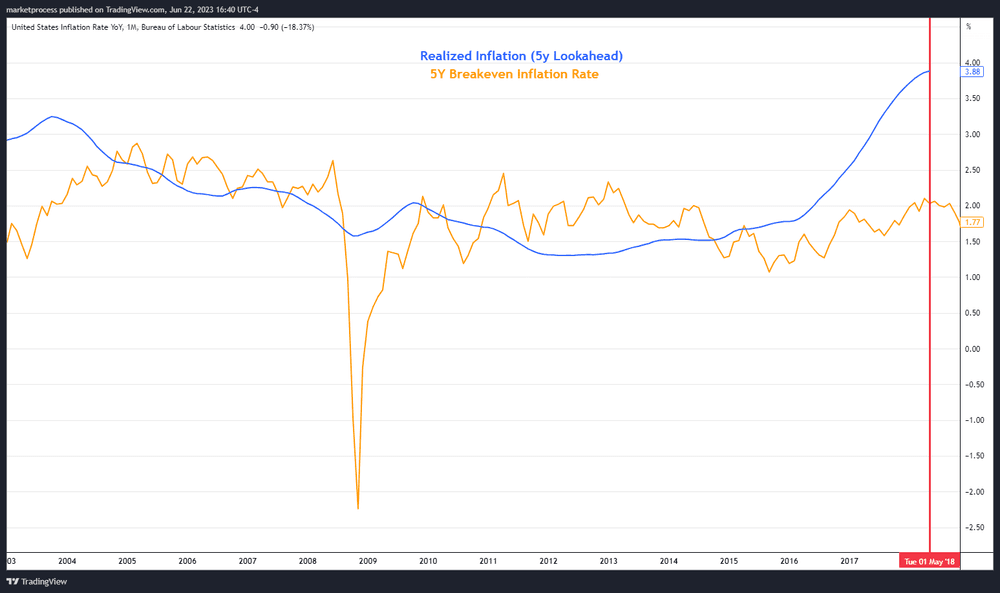
Right off the bat, you'll notice that there isn't a ton of data to analyze. If we want to examine the realized rolling 5-year inflation rates, the most recent 5-year average from today would be 2018 (2023-5). Keep in mind that 5-year TIPS trading only started in the early 2000s, which means we only have about 15 years of market data to work with.
When you take a glance at the historical chart, it's pretty obvious to the eye that the market's forecasted rates are quite volatile. They tend to veer off significantly from the actual inflation rate experienced during those periods, either crashing dramatically or lagging behind.
Most people tend to brush off these breakeven rates because, honestly, they're often way off the mark when it comes to predicting actual inflation. It's clear from the chart that they frequently either overestimate or underestimate the real deal. We completely agree that relying solely on face value as a forecaster of inflation is a terrible idea. In fact, we believe that looking at breakevens in this way is just plain wrong.
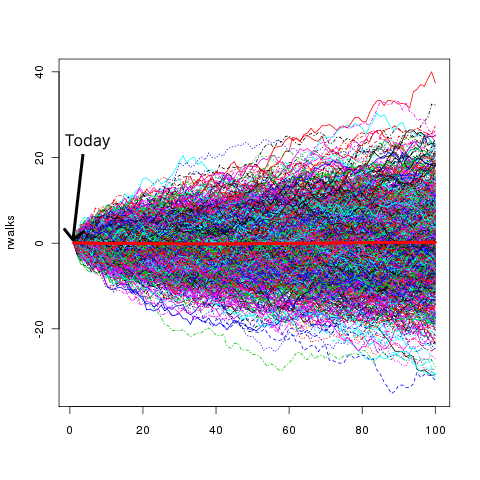
The problem with breakevens lies in their flawed assumption that there's some kind of linear connection between past events and future outcomes, based on what we observe today. But let's face it, the world doesn't work that way. That huge disconnect you see toward the end of the chart is a perfect example. It's a result of the massive inflation wave we've experienced recently. If you had told someone five years ago that we'd see the Fed balance sheet reach a staggering $8 trillion, they'd probably have thought you were crazy!
The truth is, trying to calculate all the twists and turns that could happen in the future is nearly impossible. There are so many different paths that can unfold, and it's just too complex to predict accurately. So, let's take those breakeven rates with a grain of salt and recognize their limitations in capturing the unpredictable nature of the future.
So far, we've discussed why breakeven inflation rates, on their own, aren't the best tool for forecasting. But as investors, we're always eager to find ways to grow our purchasing power. Now, you might be wondering, if breakevens aren't reliable predictors, what good are they? Well, let me explain.
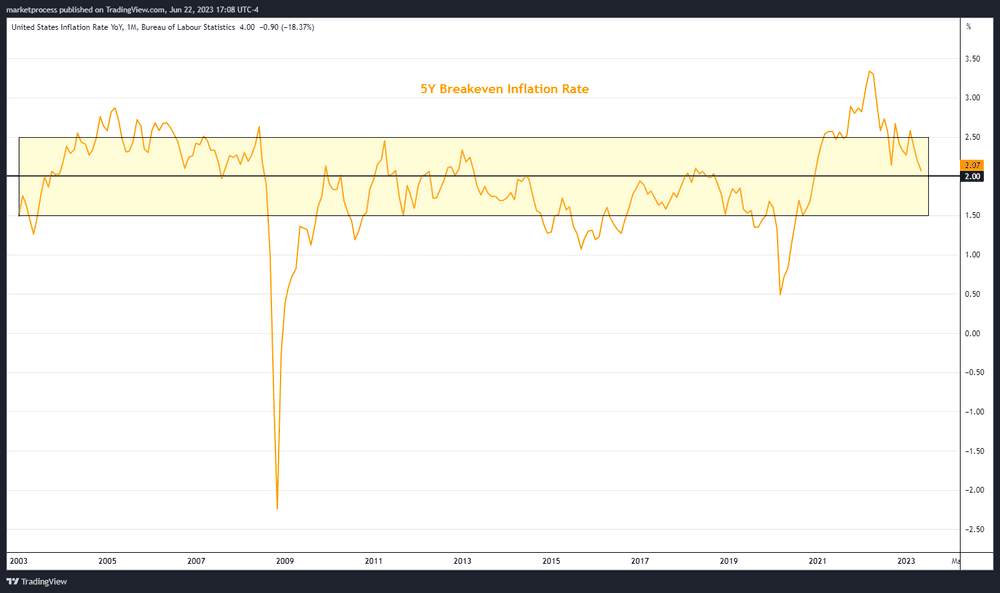
Breakevens are like refined guesses that change daily as new information comes in. They serve as a valuable indicator to help us navigate the ever-shifting landscape. Here's the thing: what makes breakevens useful is when we consider where they stand in relation to the Federal Reserve's objectives. For years, the Fed has been clear about its goal of maintaining a 2% inflation rate, specifically measured by the PCE index. With the Fed actively working to control inflation by stimulating or tightening the economy as needed, breakevens tend to hover around that 2% mark. It's like a delicate balance.
The belief is that the Fed has the power and the intention to keep inflation in check. So, when breakevens align with the Fed's objectives, they become a handy measurement for us. They give us insights into the inflation landscape and help us make informed investment decisions.
🚀 Join the Radar Community
Get free access to MacroBase and notifications about new posts and updates.
In a nutshell, breakevens aren't a crystal ball for predicting inflation, but they do offer valuable information when combined with the Fed's goals. It's all about understanding the dynamics and using these indicators as a guide.
The "2% rule" didn't become an official target for the Federal Reserve until 2012. If you've been following Powell's recent speeches, you'll notice he's been quite vocal about the importance of returning to that target range. Interestingly, one way to assess this is by looking at breakevens.
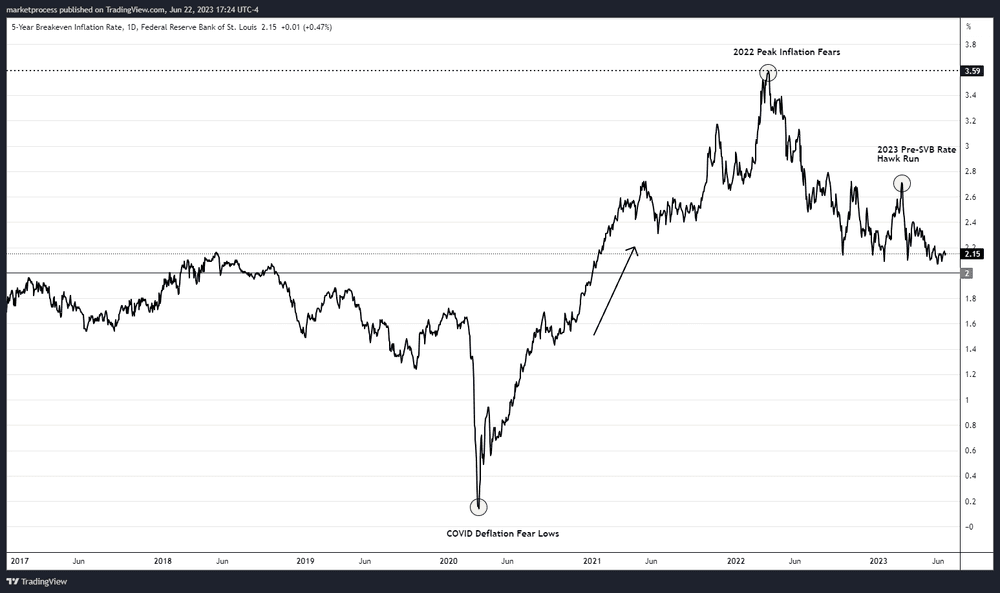
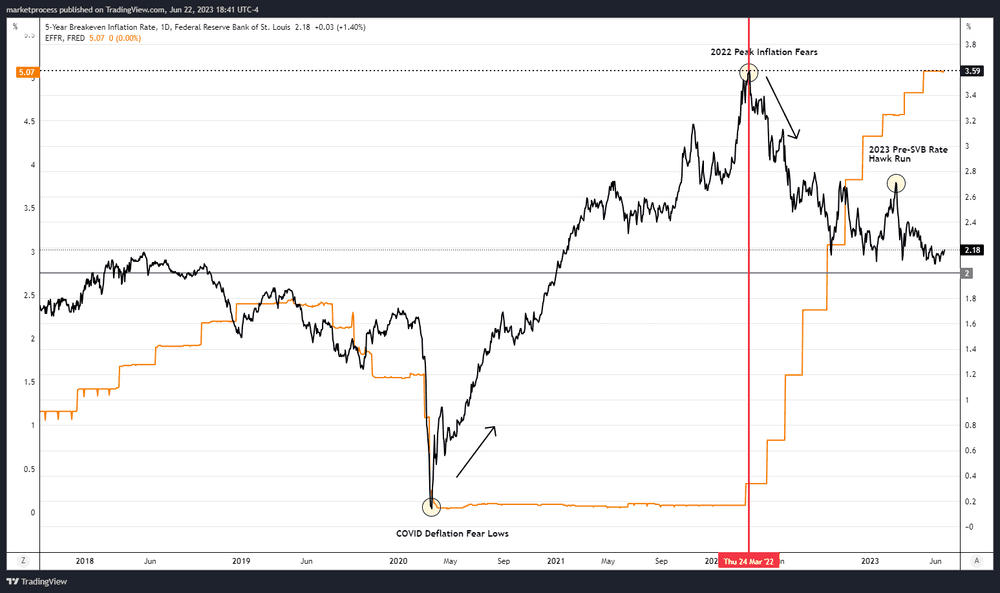
When the COVID-19 pandemic shook the markets, breakevens started to climb rapidly. This was driven by the widespread belief that the massive stimulus measures would fuel inflation. Breakevens surged past the 2% mark and peaked at an impressive 3.59% in 2022. It was around that time when the Consumer Price Index (CPI) was reporting year-on-year increases of over 8%.
If we take a closer look at the relationship between breakevens and actual inflation data over time, an interesting pattern emerges. Breakevens tend to be more relevant in the present moment rather than as a future forecasting tool. While they may not accurately predict realized inflation returns, they provide valuable insights into the current situation and offer clues about potential future developments.
Currently, the market is projecting inflation expectations of around 2.15% for the next 5 years, which aligns closely with the Fed’s target of 2%. It's worth noting that this doesn't automatically trigger a restart of QE by the Fed. Rather, it suggests that based on the market's assessment, the Fed's current policies are gradually becoming more restrictive to bring inflation back in line with its target over the next 5 years.
Powell has repeatedly mentioned that "inflation expectations remain well anchored," referring to the market's perception that the Fed is effectively managing inflation. This indicates that the Fed's actions and policies are instilling confidence in the market, allowing inflation expectations to remain steady. While breakevens may not be foolproof in predicting future inflation, they offer valuable real-time information and serve as a gauge of market sentiment regarding the Fed's ability to control inflation.
It's highly likely that inflation expectations will eventually dip below 2%, most likely during a recession. Looking at the chart provided, it's clear that current inflation conditions play a major role in shaping the outlook for inflation expectations. A striking example is seen in 2008 when breakevens reached their lowest point, forecasting an average inflation rate of -2.24% over 5 years! Little did they know back then about the colossal quantitative easing (QE) efforts that were about to be unleashed.
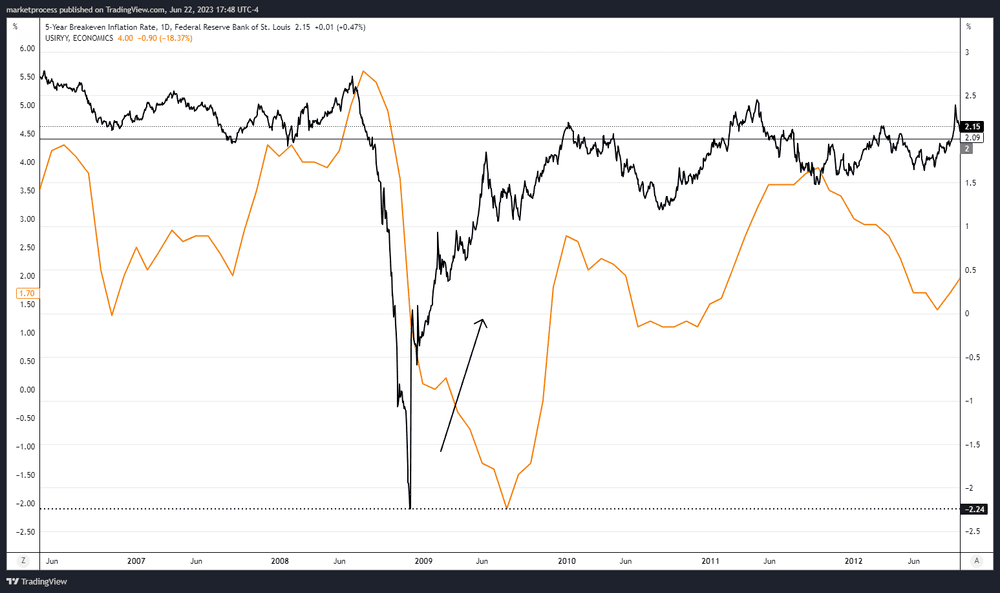
It just goes to show that breakevens can miss the mark when it comes to capturing the full impact of unforeseen events like the QE monster of ‘08. These unexpected twists and turns remind us that market predictions aren't always foolproof and can be blindsided by the magnitude of policy interventions and economic shifts.
An alternative way to utilize breakevens is by assessing the near-to-medium-term efficacy of Fed policy, which can be referred to as the Real Fed Funds Rate. It's worth noting that the approach I'm about to outline differs from the conventional interpretation favored by many, which aligns with the definition provided by the Fed itself:
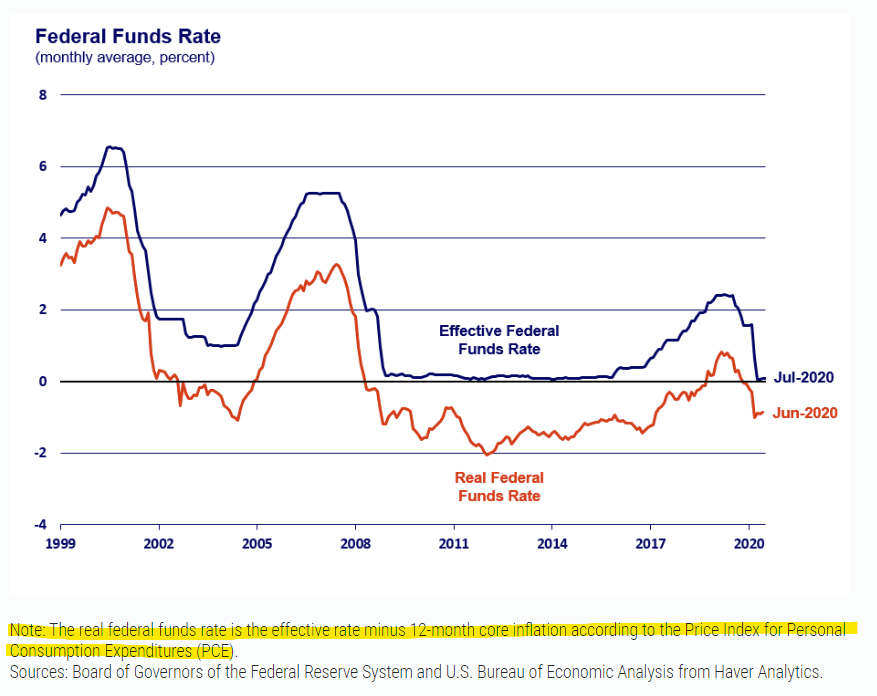
The calculation mentioned above assumes that the market actually cares about the Real Fed Funds Rate. But the truth is, this rate is somewhat outdated because it relies on past data rather than considering current policy and forward expectations, which are the real driving forces behind market behavior. Ideally, inflation shouldn't swing wildly, so there should be little difference between these two calculations in terms of where inflation stands and where it's expected to go, especially when we're hovering around the Fed's 2% target.
However, when inflation starts behaving erratically, that's when a gap starts to appear. The lagging nature of the calculation based on prior data fails to capture the real-time market sentiment and expectations surrounding inflation. In such cases, market dynamics can be significantly influenced by the swift changes in inflation, creating a window of disparity between the calculated rate and the actual market conditions. As outlined below:
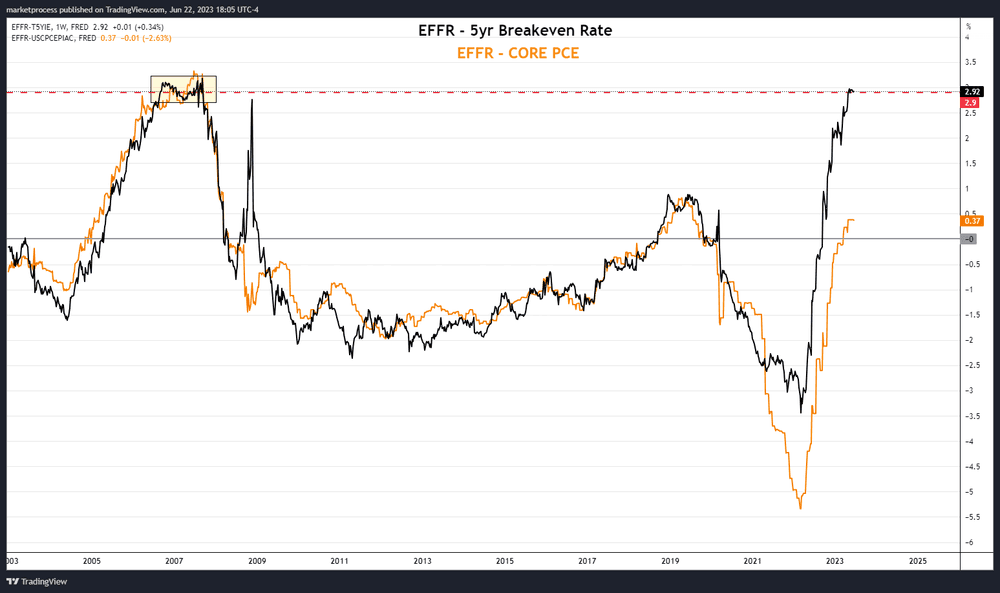
The difference between using 5-year breakevens and Core PCE is quite significant right now, and it's mainly due to the wild swings in inflation. Here's the thing: out of the two methods we discussed, only breakevens have any relevance for predicting future inflation. Stale data points like Core PCE don't tell us anything about where inflation is heading.
We've established that breakevens may not be spot-on when it comes to long-term inflation forecasts, but they do a pretty decent job of telling us where inflation is headed today. So, as long as breakevens don't climb higher from their current level, it suggests that the Fed's policy can effectively control inflation going forward. However, if breakevens start rising again while the Fed remains in the same position, it's a sign that they might need to step up their game because inflation could get out of control. Basically, what the Fed has done so far has worked.
Let me give you an example to help illustrate this point. When the bond market caught wind of the Federal Reserve raising rates, it quickly factored in a peak in inflation expectations. As a result, breakevens started to ease off as soon as the Fed began hiking rates, and this downward trend continued over the past year.
It's worth noting that the Fed tends to be a bit behind the curve, so we can't say for sure how much they might overtighten the economy going forward. However, we do believe that their current approach is restrictive enough to keep rates steady.
We’ve explained breakeven rates are more weighted toward real-time events. You have to look at these rates with an emphasis on TODAY and what is EXPECTED, not what becomes. A recession could hit tomorrow and throw everything off (Covid/GFC for example). Just as these rates are updated every day so is everything else in the markets. In the world of economics, anything can happen, so let's stay tuned to see how the dice roll!