The QuantDeck - 01.09.24
Overview Over the past day, we introduced our new and improved daily report the QuantDeck, replacing our old Weather Report. Right now, you can see the System and Ares sections in the QuantDeck. However, we're still working on adding other parts like Astraeus

Overview
Over the past day, we introduced our new and improved daily report the QuantDeck, replacing our old Weather Report. Right now, you can see the System and Ares sections in the QuantDeck. However, we're still working on adding other parts like Astraeus (Crypto Strategy) and Hercules (Short Vol Strategy). As we finish and test them, they'll be added to the report one by one, showing up as new slides in the QuantDeck. This has been a multi-month effort and we’re happy to finally share our findings with you all.
Process
The objective behind creating the QuantDeck was to enhance the depth and resilience of our System, while also broadening the capabilities of Ares and other associated models. To achieve this, we revamped the foundational structure of the previous System to create something more streamlined and robust. Consequently, the historical data outputs underwent modifications. To ensure consistency with our core principles, it was imperative to similarly revise and restructure our models. Throughout this process, our primary concern was to avoid overly tailoring our models to fit the updated System, a cautionary approach we also adopted with Ares in the previous iteration. As a result of these refinements, there are some nuanced changes in how both the System and Ares should be interpreted moving forward.
The Changes
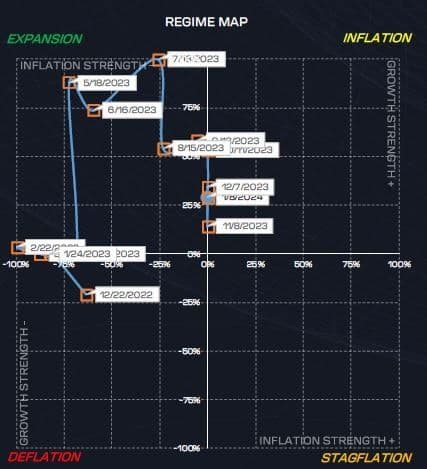
To begin with, the QuantDeck has been updated to present recent trends using a Regime Map, shown as a scatter plot, instead of the previous Regime Matrix, which was in table format. In this new display, the current trend or regime is highlighted in blue within an orange box, making it easier to identify our present position. It's important to note that the Regime Map is designed to reflect the most recent trend direction. For instance, although we are currently in an Inflationary Regime, the position on the X-axis is at 0, indicating a neutral inflation index. This suggests that we are in a transitional phase between expansion/inflation. Until a clear direction is established, the Regime Map will maintain the previous regime's state until the neutral trend on the inflation index is resolved. For context, as you can see by the historical plots, we were in Expansion, but there was a short inflation print a few months ago (in conjunction with Stage 3 of the Compound Landing) and since then there haven’t been enough disinflationary pressures on the inflation index to bring us back to bearish trend, in turn keeping us in this borderline inflation/expansion regime.
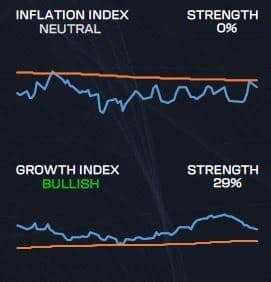
The way we show the details of each regime has been updated. Instead of just showing a Strength percentage, we now display both the System's growth and inflation index trends and respective strengths. This change allows users to better understand the direction of growth and inflation. These trends in growth and inflation determine which regime we are currently in.
Let’s cover exactly what has changed in the new version of Ares.
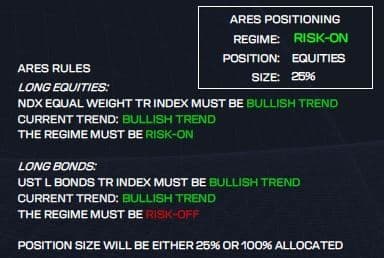
Positioning:
🚀 Join the Radar Community
Get free access to MacroBase and notifications about new posts and updates.
- New: Equities or Bonds
- Old: Equities or Bonds and Gold
Size:
- New: Dynamically shifts between 1 (100%) and 1/4 (25%) allocation of the holding depending on System internals.
- Old: Constant at 100%.
Filters:
- New: NDX EW Total Return Index trend for equities and UST Long Bond Total Return index for bonds. (This would be most similar to QQQE and TLT adj. for div. on TradingView. The trends may differ slightly by a day or two but the general picture is there). The trends are supplied under Current Trend in dynamic format for both NDX and UST LB in the rules.
- Futures trends and performance metrics were taken out of the equation to give a more total return perspective on Ares unleveraged and prevent comparing total return equal weight on Nasdaq to contract roll costs of the bond futures contracts on a trend basis. While we like futures as they are an extremely liquid product, it is best to compare assets in their purest form for modeling and backtesting. How/if you leverage returns beyond Ares unelveraged comes as certain costs that should be factored in depending on your approach.
- Old: RSP (SPX equal weight) trend for equities and ZB trend (long bond futures).
Allocation time:
- New: Enteres and exits positions into the close of the trading session.
- All model shifts (Positioning/size etc) are indicated as to happen at the close of the next session, they are NOT what was done in the prior section. For example, if the Size moves from 25% to 100%, it is implied the model will size up at the close of trading of the session following the release of the report.
- Old: Enters orders into the opening of the trading session.