The Real Reason Bitcoin Can't Bounce

The Setup
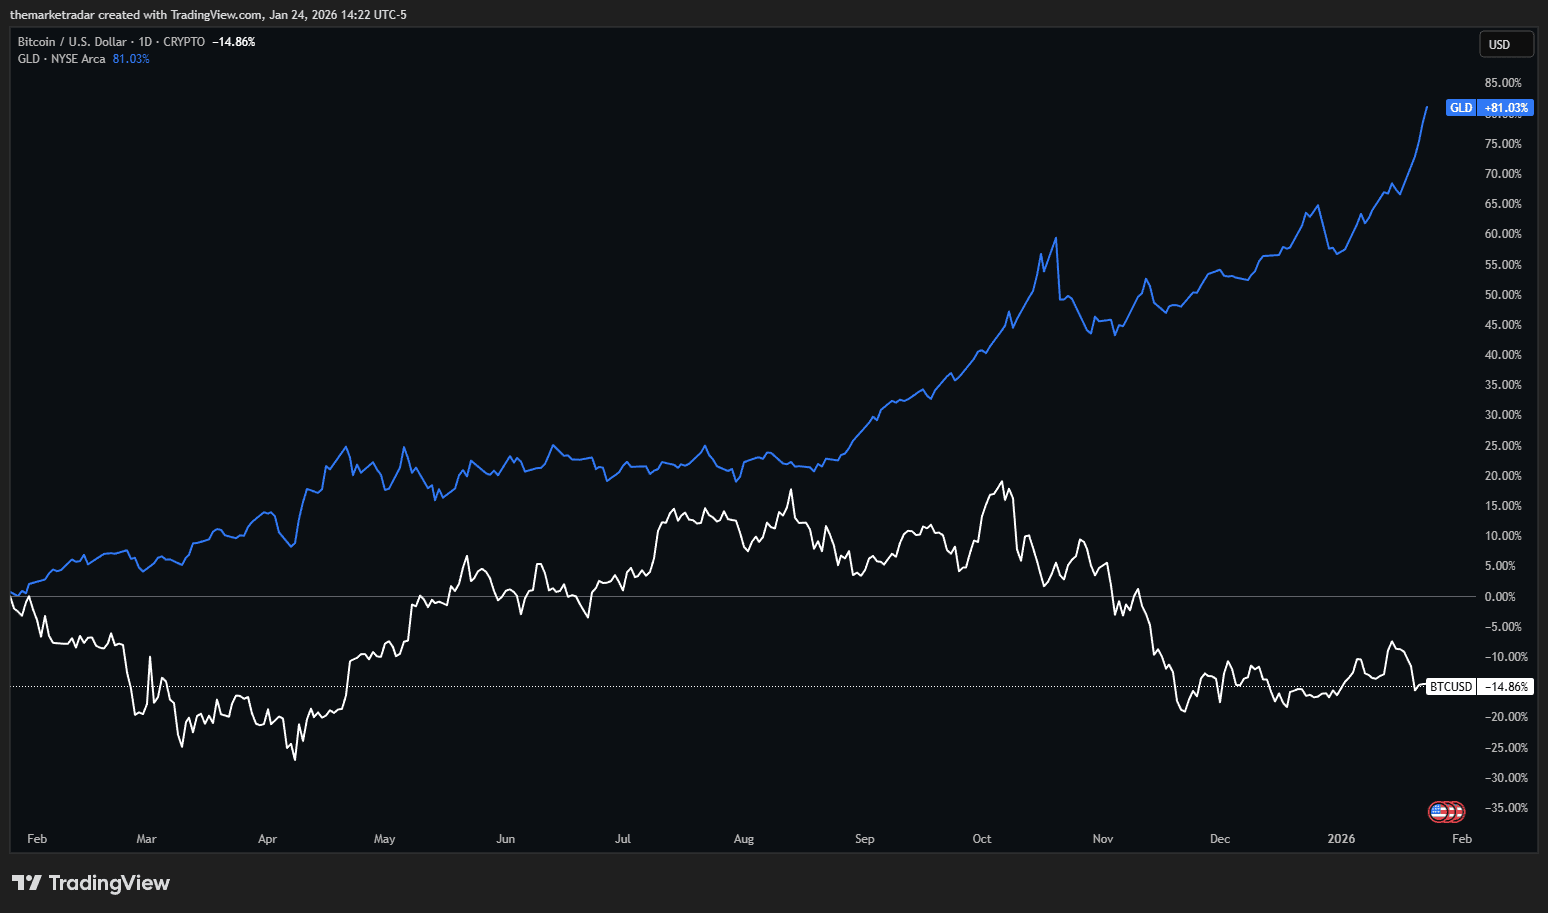
The setup looks almost too clean. Gold is ripping higher in what's shaping up to be a generational move, up more than 55% in 2025 with nearly 50 all-time highs, peaking above $4,370 per ounce. Equities are stabilizing near all-time highs. And for the first time since summer, the System has flipped back to Risk-On. By every measure that matters, this should be Bitcoin's moment.
And yet, it isn't.
Price remains stuck in a bearish trend, grinding sideways while gold steals the spotlight. The explanations floating around range from lazy to outright wrong. Some blame regulatory uncertainty. Others point to the halving cycle. A few have latched onto fears about quantum computing after BlackRock added risk warnings to its IBIT filing in May. None of these explanations holds up under scrutiny.
The real answer is simpler, but it requires abandoning a narrative that most of the crypto world still clings to. Bitcoin isn't lagging because something is broken. It's lagging because it was never what the maximalists claimed it was in the first place.
The Framework
For years, the maximalist crowd campaigned hard on the idea that Bitcoin would eventually replace gold as the global reserve asset. Digital gold. A superior store of value. To be fair, it's not an illogical argument on paper. But we've been adamant about not front-running a shift in the macro order. Let Bitcoin prove its reserve characteristics before diving in headfirst.
Our view has always been simpler: Bitcoin and gold aren't competing with each other. Gold competes with bonds. Bitcoin competes with stocks.
Think of it this way. Gold is the ultimate bond, one with no default risk but also no coupon. It's where capital flows when inflation and sovereign credibility concerns push investors closer in on the risk curve, away from duration and toward something that can't be printed or defaulted on. Bitcoin, by contrast, is the riskiest asset on the board. It represents fractional ownership of something entirely digital, something you can't touch, something with no real-world utility outside of financialized products. Bitcoin is the release valve for liquidity when conditions are good and investors want to push further out on the risk curve. It's an enhanced version of equities, not a competitor to gold.
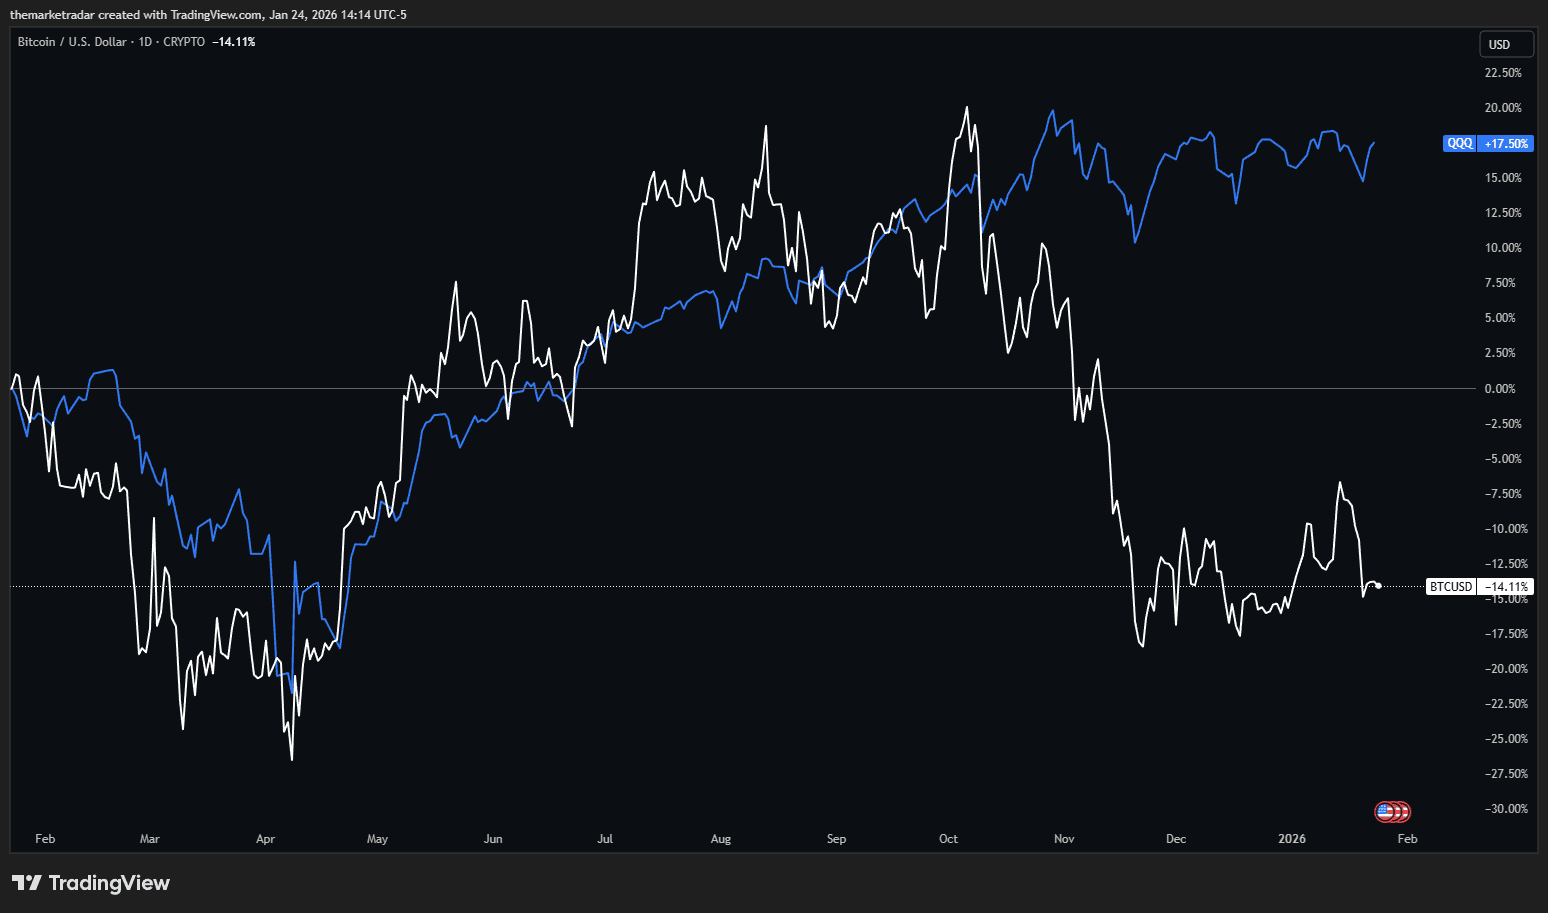
2025 proved this distinction decisively. While gold surged on safe-haven flows, central bank buying, and falling real yields, Bitcoin crashed 30% from its October peak. Every major asset class posted positive returns except Bitcoin. The "digital gold" narrative didn't just underperform; it inverted. Gold won the flight-to-safety trade; Bitcoin got sold alongside other risk assets. That's not how a store of value behaves. That's how the riskiest asset on the curve behaves.
Once you accept this framework, the current divergence starts to make sense. If Bitcoin competes with stocks, if it's the release valve for excess liquidity beyond what equities can absorb, then it doesn't just need liquidity. It needs abundant liquidity. And that's exactly what it doesn't have right now.
The Liquidity Squeeze
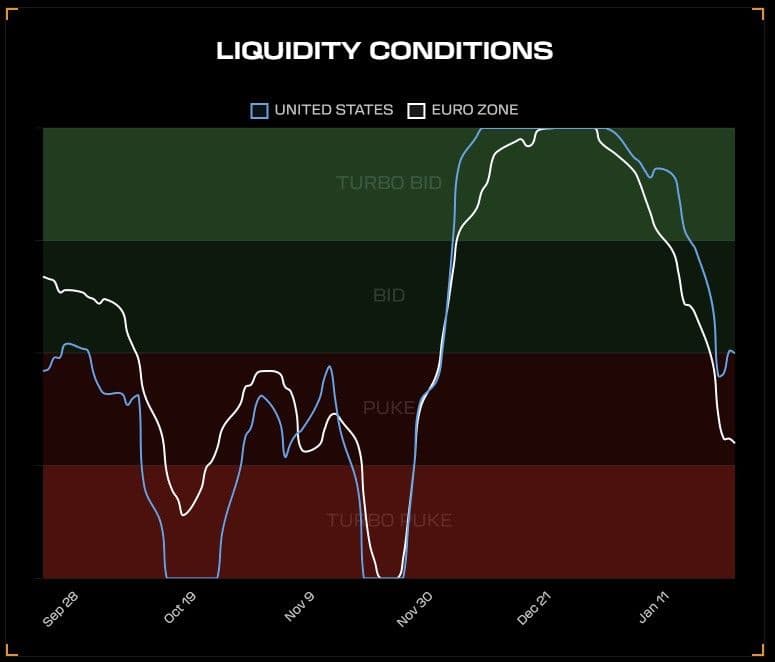
Our Liquidity Conditions Index peaked in late December. At the time, conditions looked promising; Bitcoin had been basing for months and grinding toward its momentum line. That window has closed. Liquidity conditions have rolled over and continue to weigh on price.
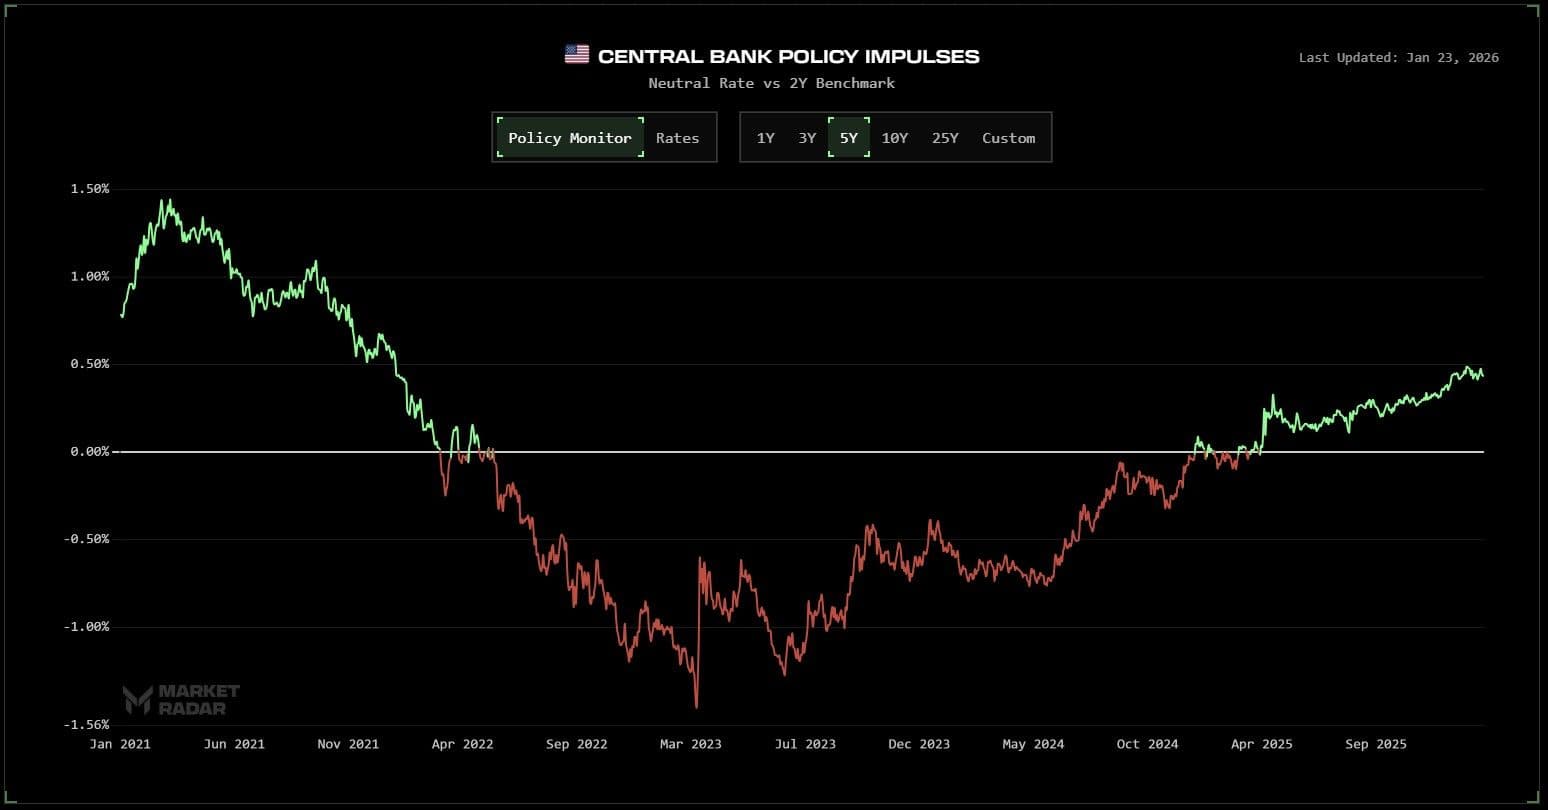
The obvious place to look is the Fed. But our Neutral Rate Estimator suggests the Fed remains roughly neutral to slightly accommodative at current policy levels. So the Fed isn't the problem.
There's another source of liquidity pressure that most analysts miss entirely: the Bank of Japan. In December 2025, the BOJ raised rates to 0.75%, the highest level in 30 years. This matters because of the yen carry trade. For years, investors borrowed yen at near-zero rates and deployed that capital into higher-yielding assets globally, including risk assets like Bitcoin. Estimates put outstanding yen-funded carry positions above $3.4 trillion.
When the BOJ tightens, the yen strengthens, and those leveraged positions unwind. Bitcoin, as the most liquid risk asset trading 24/7, becomes the first thing sold when carry traders need to raise cash. The pattern is remarkably consistent: Bitcoin fell 23% after the March 2024 BOJ hike, 26% after the July 2024 hike, and 31% after the January 2025 hike. December's move to 0.75% preceded yet another leg lower.
The Fed can be neutral, domestic conditions can be supportive, and Bitcoin can still face liquidity headwinds from a central bank on the other side of the world. That's the reality of trading the riskiest asset on a globally connected curve.
But the BOJ dynamic only explains why liquidity is tightening. It doesn't explain why Bitcoin gets hit so much harder than equities when it does. For that, we need to look at something more structural.
The Passive Flow Gap
The stock market has an enormous passive flow cushion that Bitcoin simply doesn't have.
Consider the numbers. Vanguard's S&P 500 ETF (VOO) alone pulled in $116 billion in net inflows in 2024, the largest single-year haul for any ETF in history. In 2025, VOO attracted another $65 billion through May. One fund, tracking one index, absorbing more capital in a single year than the entire Bitcoin ETF complex has gathered since launch.
And VOO is just the tip of the iceberg. Americans hold $9.3 trillion in 401(k) plans and another $18 trillion in IRAs. Every two weeks, without any active decision, capital flows from paychecks into target-date funds and index funds that automatically allocate to equities. These flows are largely insensitive to short-term liquidity conditions. They show up regardless of whether the macro backdrop is Risk-On or Risk-Off. They don't require active decisions from advisors or allocators. They just happen.
Bitcoin has none of this. Yes, ETFs now exist, and they've become the primary price driver, replacing the halving cycle as the main demand catalyst. IBIT attracted $25.4 billion in 2025, ranking sixth among all ETFs by inflows despite posting negative returns for the year. That's impressive for an asset class that didn't have regulated products two years ago.
But ETF allocations are active decisions. Advisors aren't auto-allocating client portfolios to Bitcoin. Pension funds aren't rebalancing into IBIT every quarter. Target-date funds don't include a 2% Bitcoin sleeve; CNBC confirmed that the ten largest target-date fund managers don't allocate to crypto, and Fidelity explicitly stated they have no plans to add Bitcoin to their TDFs. When someone buys a Bitcoin ETF, they're making a conscious choice to take on risk, and when liquidity tightens, those discretionary flows dry up first.
This creates an asymmetric response to liquidity contraction. When conditions tighten modestly, not enough to trigger recession fears, not enough to crater corporate earnings, equities hold up on passive flows while Bitcoin rolls over. The passive bid keeps stocks elevated. Bitcoin has no such floor.
This isn't just theory. We saw exactly how this plays out in real time back in October.
The October Cascade
On October 10, 2025, Trump announced 100% tariffs on China in response to their rare earth export controls. Risk assets sold off across the board. The S&P 500 fell 2.7%. The Nasdaq dropped 2.7%, sharp moves but orderly. Equities absorbed the shock and stabilized.
Bitcoin didn't absorb anything. It cascaded. Price collapsed from $122,000 to $103,000 in hours, a 16% drawdown, while equities lost less than 3%. The liquidation cascade that followed was the largest in crypto history: $19 billion in forced selling over 24 hours, with $7 billion wiped in the first hour alone. Over 1.6 million trading accounts were liquidated. The leverage embedded in crypto markets, the same leverage that amplifies upside when liquidity is abundant, turned into a self-reinforcing selloff.
Join the Radar community
Create a free account to preview the QuantBase Terminal and get notified when new posts go live.
No spam · No credit card · Instant access
The ratio tells the story: Bitcoin's drawdown was roughly 6x the magnitude of equities. That's not because Bitcoin is broken. That's because Bitcoin sits at the far end of the risk curve, amplifying moves in both directions, with no passive flow cushion to dampen volatility. When liquidity pulls back even modestly, Bitcoin feels it first and feels it hardest.
What followed the crash was a reflexive bounce, the kind that traps traders looking to "buy the dip." Bitcoin recovered to $116,000 by late October. That's when ASTRAEUS, our Bitcoin trend strategy, signaled the exit. The bounce looked healthy on the surface, but the underlying regime had already shifted. We moved our Bitcoin allocation to cash and have remained there since.
From $116,000, Bitcoin proceeded to grind lower for the next three months, eventually breaking below $90,000. The entire decline happened with ASTRAEUS on the sidelines. This is exactly what the system is designed to do: participate in the upside when trend and regime align, and step aside when they don't. No prediction required. Just discipline.
The October shock also exposed something else. Bitcoin is now subject to structural selling pressures that equities simply don't face, and they persisted long after the initial crash subsided.
The Overhang
Over November and December, Bitcoin ETFs saw $4.57 billion in net outflows, the worst two-month stretch since the products launched in January 2024. Headlines screamed institutional capitulation. That wasn't what happened.
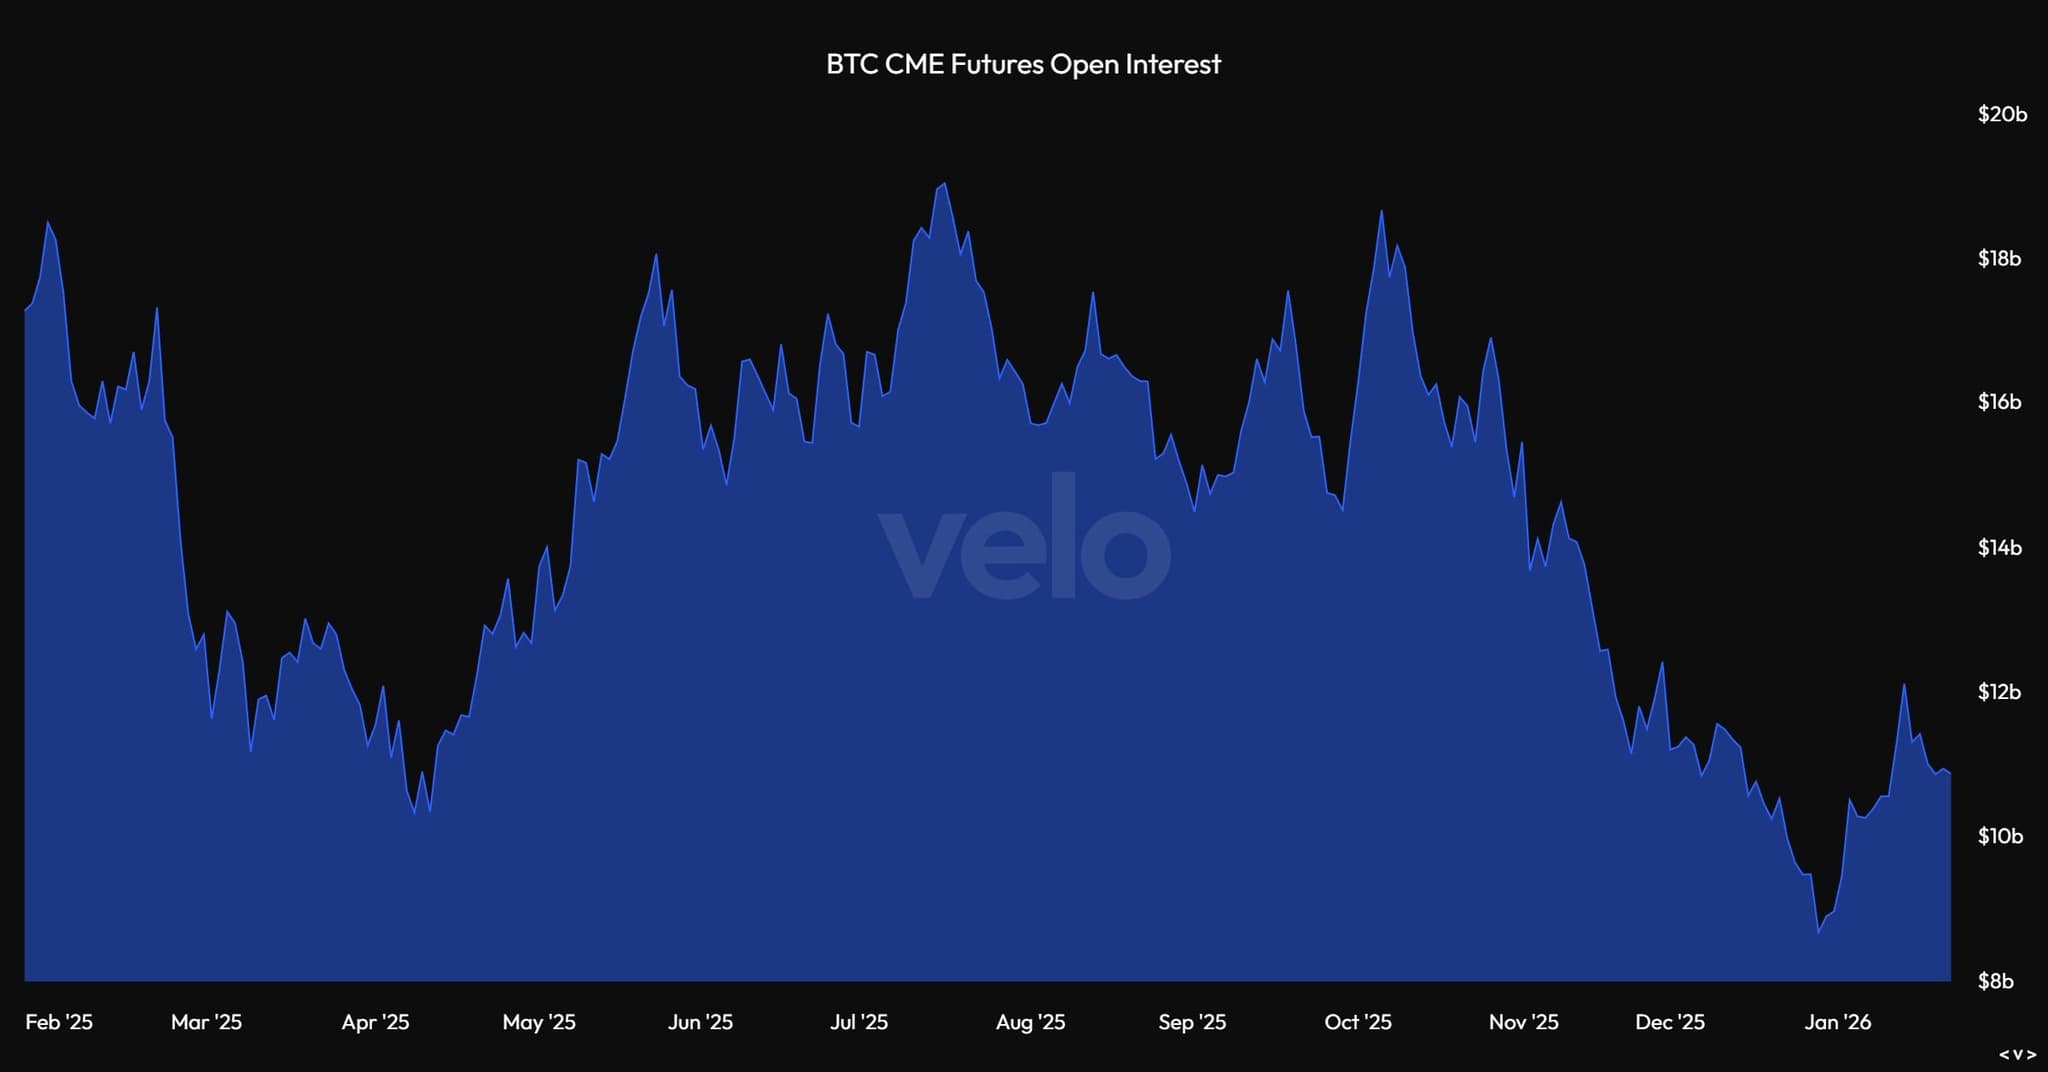
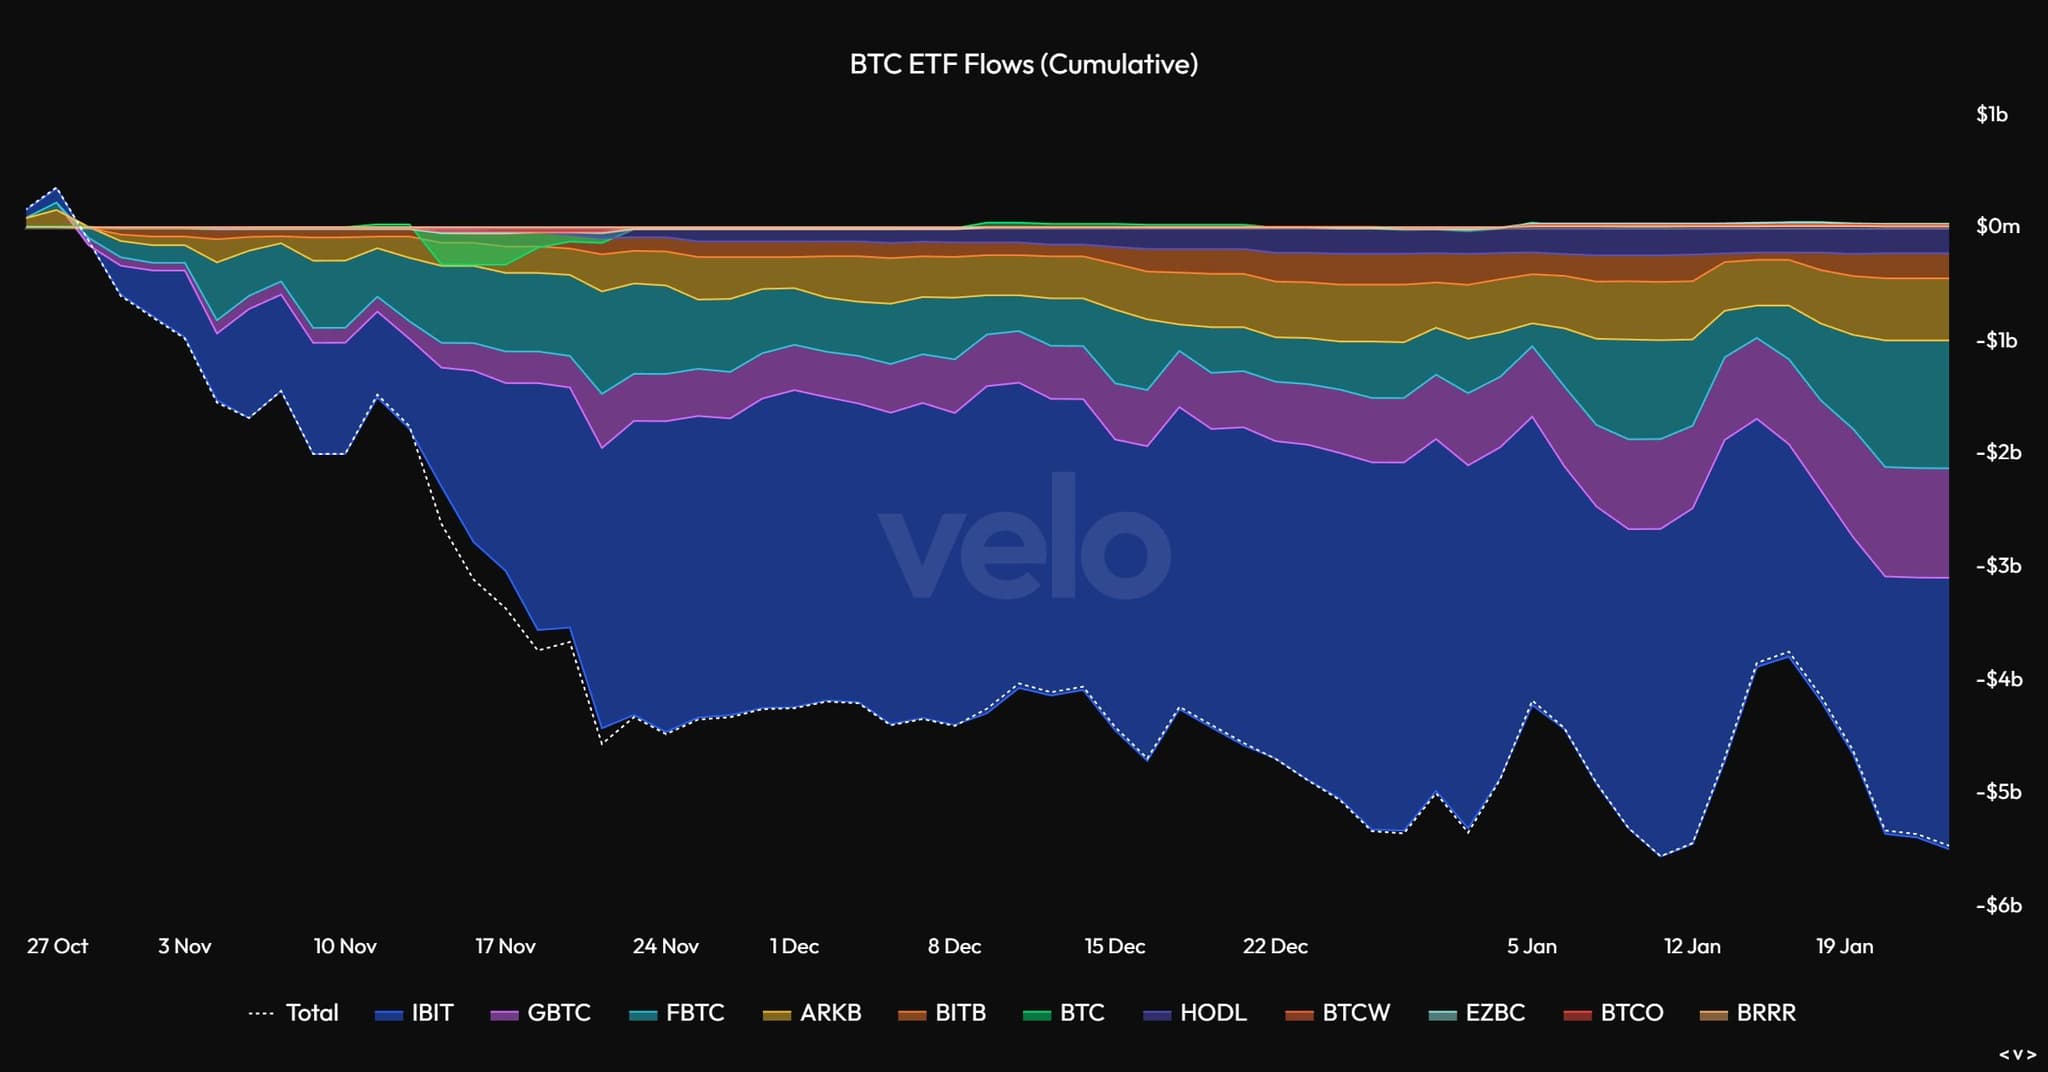
Research from Amberdata revealed the selling was highly concentrated. BlackRock's IBIT dominated 97-99% of weekly outflows despite holding only 48-51% of assets under management. Other funds like Fidelity's FBTC actually saw inflows. What drove the outflows wasn't broad institutional panic; it was arbitrageurs unwinding basis trades. These are strategies where you buy the spot ETF and short futures to capture the spread. When that spread compresses or goes negative, both legs get closed: sell the ETF, cover the short. Bitcoin perpetual futures open interest dropped 37.7% alongside the ETF outflows, moving in near-lockstep with a 0.878 correlation.
The basis trade unwind is mechanical, not fundamental. But it created sustained selling pressure through year-end that equities didn't experience. You can see this below by the steep decline in CME Open Interest and IBIT ETF flows.
Then there's the long-term holder distribution. Approximately 1.6 million BTC has been sold by long-term holders since 2024, and nearly 2 million BTC since the 2025 peak. When Bitcoin crossed $100,000 for the first time, early adopters sitting on 3x, 5x, and even 10x gains locked in profits.
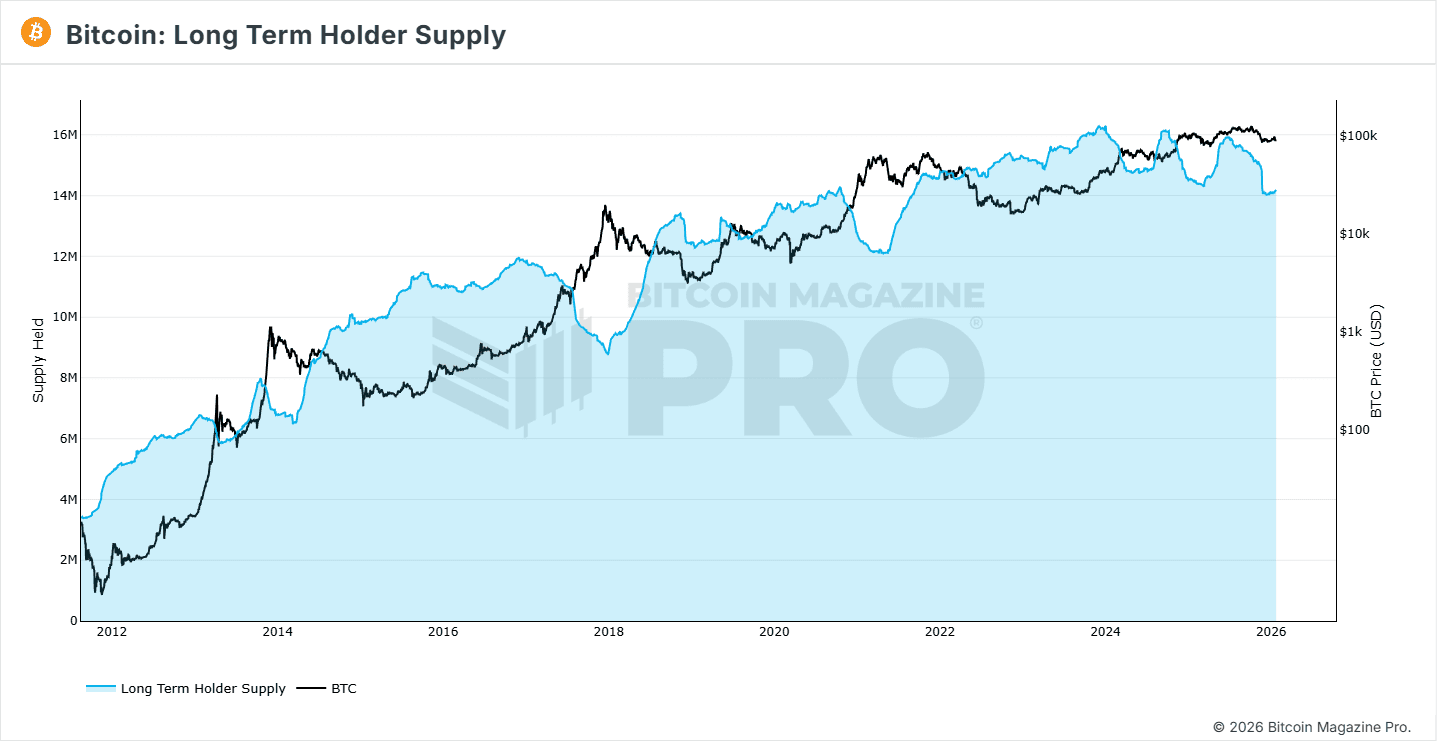
This isn't cycle-top distribution. It's measured profit-taking from investors who've been holding for years. But it creates a steady supply overhang that requires constant demand to absorb. Equities don't face this dynamic; corporate buybacks, passive inflows, and diversified ownership structures spread selling pressure across a much broader base.
So where does that leave us? Bitcoin faces a liquidity squeeze from the BOJ, no passive flow cushion to absorb selling pressure, and structural overhang from basis trade unwinds and long-term holder distribution. The setup is hostile. But it won't stay that way forever.
The Path Forward
Even as these headwinds persist, the regime backdrop is shifting in Bitcoin's favor, slowly.
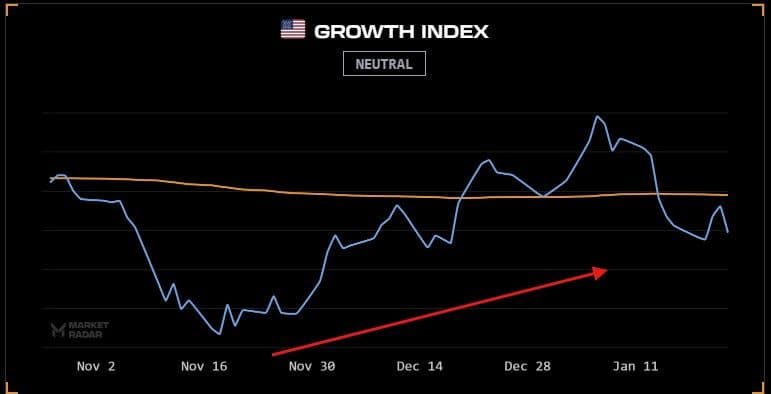
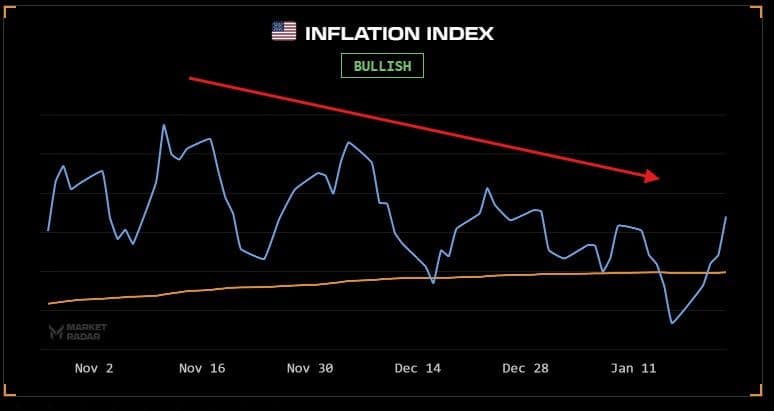
Growth and inflation impulses are moving in opposite directions, signaling the market is beginning to price an expansionary regime: disinflation with rising growth. Historically, expansionary regimes are favorable for Bitcoin, but the lack of inflationary impulse means liquidity isn't being actively injected. That's been enough to push capital down the risk curve, with safer sectors like industrials, healthcare, and consumer defensives outperforming tech over the past month.
The key signal to watch is when risky assets start outperforming again. That's when risk appetite is truly expanding. Bitcoin sits at the far end of the spectrum; it only moves when risk-taking hits peak levels. We likely won't see that until QQQ breaks out to new all-time highs, which should coincide with our growth index pushing deep into bullish territory. Right now, growth is hovering around momo. Risk-on impulses are present, but too muted to bleed into the riskiest assets.
Technically, Bitcoin remains in a bearish trend, and bearish trends tend to lead to lower prices. The first step toward recovery is a break and hold above Mid-VAMP (the grey line), something we briefly saw in January before it failed. The next step is a break above momo and a flip into a bullish trend. That, coupled with a Risk-On regime, is our criteria for a high-conviction leveraged long.
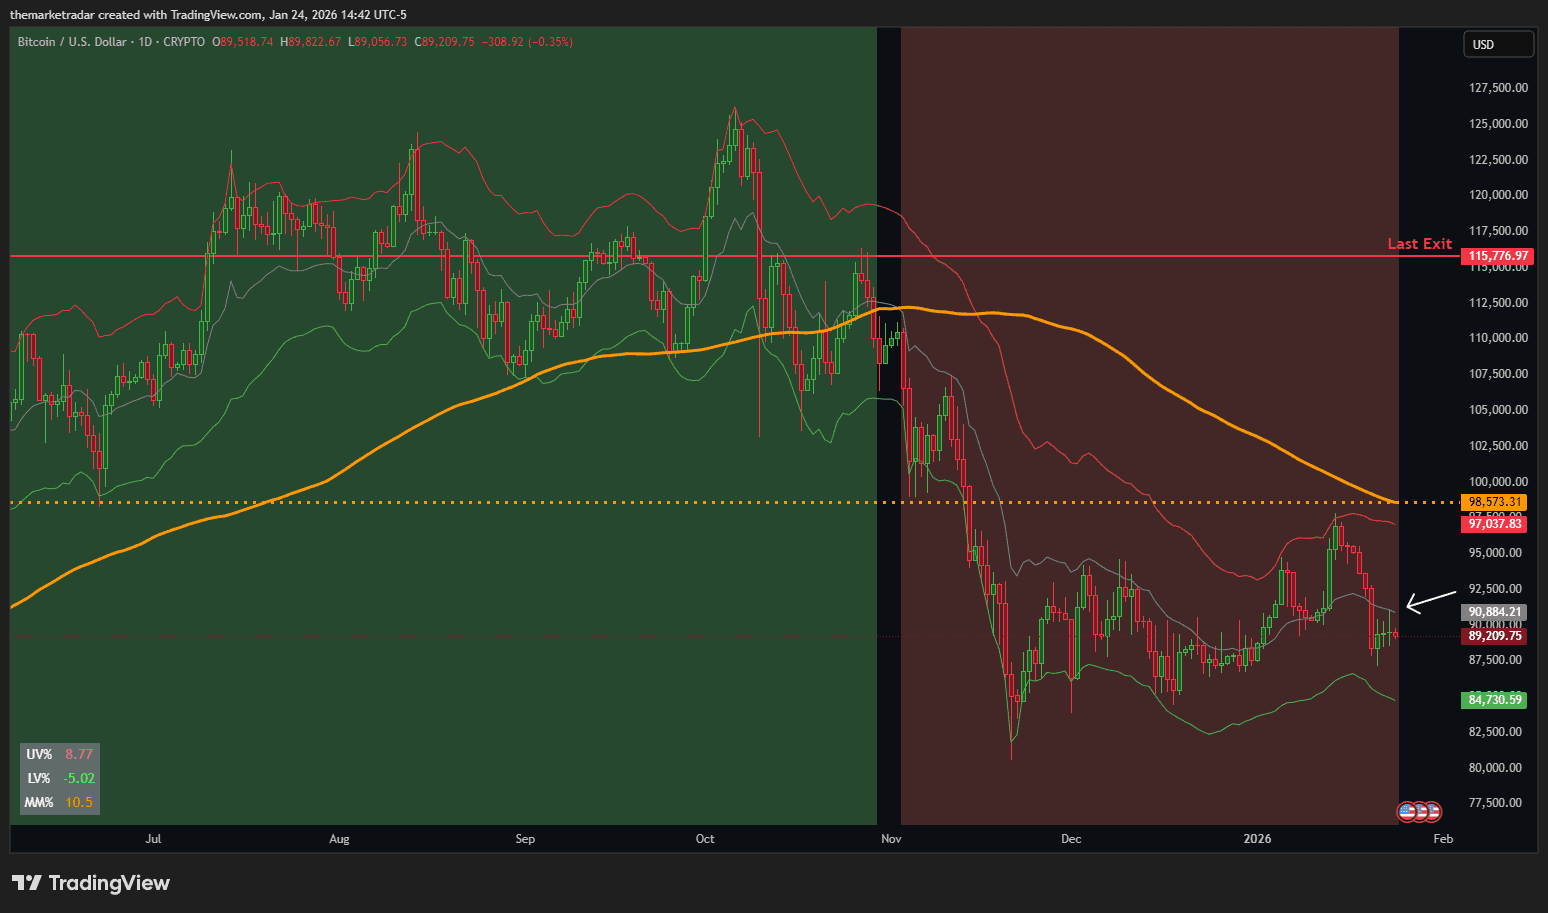
Until that happens, this is a falling knife we're not willing to catch. Momo is right there; the risk in waiting for confirmation doesn't leave much money on the table. That's the cost of insurance, and we're happy to pay it.
Our Outlook
Let's be direct about where we stand.
Bitcoin is facing a hostile setup. Liquidity conditions are tightening globally, with the BOJ draining yen carry positions while the Fed sits neutral. There's no passive flow cushion to absorb selling pressure the way there is for equities. Structural headwinds from basis trade unwinds, and long-term holder distribution continue to weigh on price. And technically, Bitcoin remains in a bearish trend.
None of this means Bitcoin is finished. It means the conditions necessary for a sustained move higher aren't present yet.
The regime is improving. Risk-On is confirmed. But regime alone isn't enough. ASTRAEUS, our Bitcoin trend strategy, requires both regime and trend to align before taking a position. Right now, we have the regime but not the trend. Price remains below momo in a bearish structure. A break and hold above Mid-VAMP, followed by a flip above momo, would signal the turn.
All the liquidity dynamics we've outlined, the BOJ tightening, the passive flow gap, the structural overhang, these explain why the trend hasn't flipped yet. But we don't try to predict when liquidity will turn. We let price lead. When DDAP signals a bullish trend, ASTRAEUS enters. Until then, this is a falling knife we're not willing to catch.
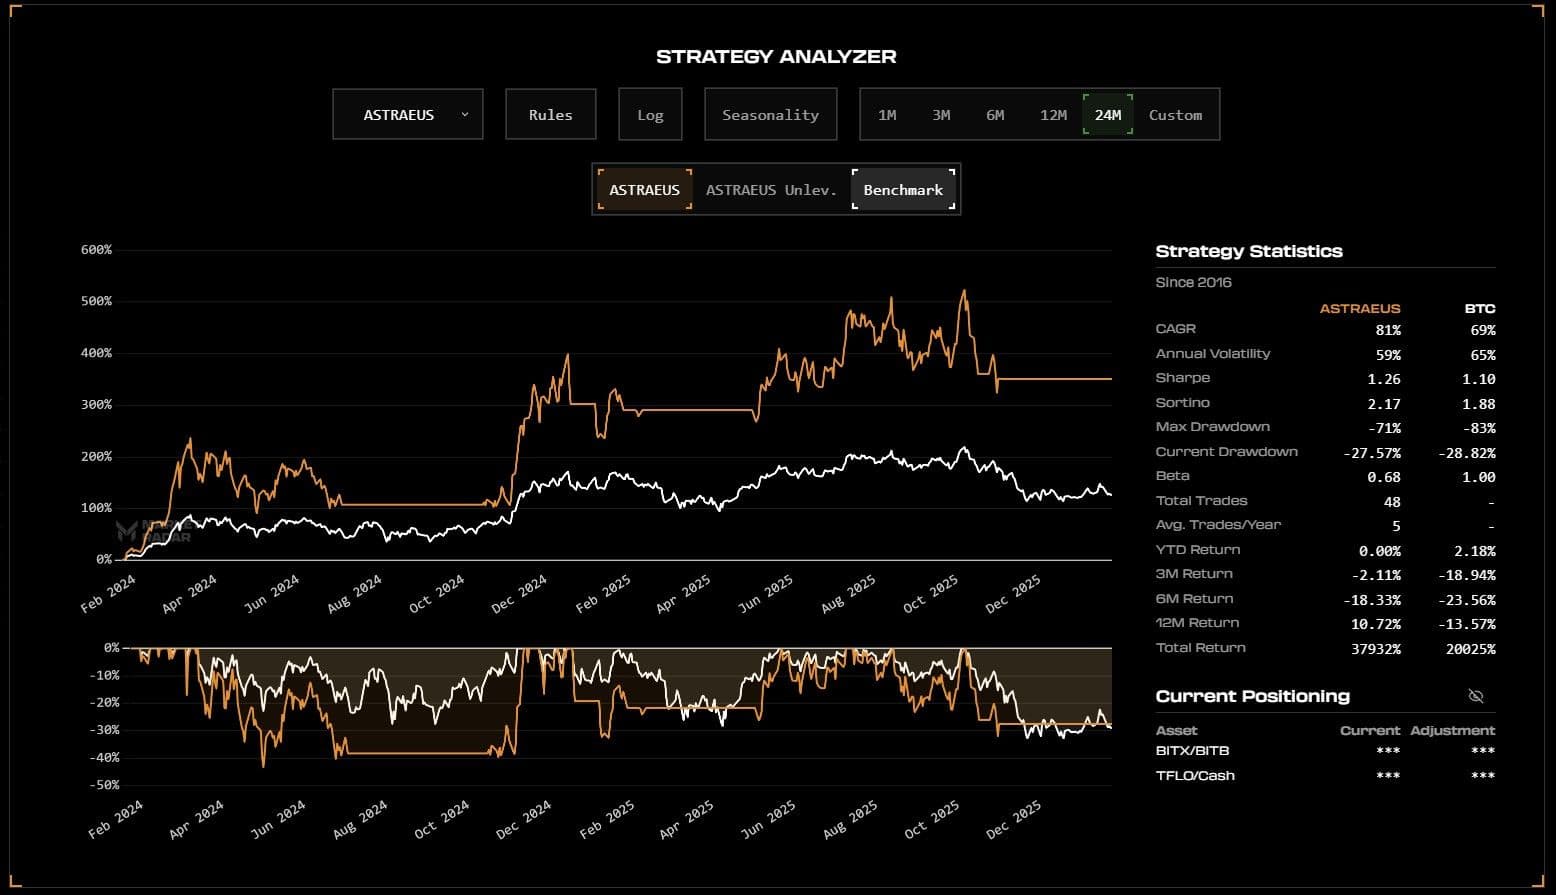
We've been in cash on Bitcoin since the $116,000 exit in late October. The entire three-month decline from there to below $90,000 happened with us on the sidelines. That wasn't a guess. That was the system doing exactly what it's designed to do: stay long when conditions align, step aside when they don't.
Since 2016, that discipline has compounded. ASTRAEUS has delivered 379x total returns versus 200x for buy-and-hold Bitcoin, with a max drawdown of 71% compared to 83%. It averages just five trades per year. The edge isn't in calling tops and bottoms. It's in waiting for the regime and trend to confirm, then acting with conviction and size.
When the trend flips, we'll be ready. Bitcoin rewards patience and punishes impatience. For now, we wait. Cash is a position. And in a bear market, it's often the best one.
If you want access to ASTRAEUS signals, real-time regime updates, and the full RQF portfolio, join Market Radar below.
Unlock Premium Content
The remainder of this content is available to Radar members only. Subscribe to gain instant access.
Billed annually at $780 · Save $120
- Models boasting 40%+ average yearly returns
- Automated portfolio signals (RQF strategy)
- Live calls with experienced traders
- QuantBase Terminal with macro regime models
- DDAP TradingView indicator
- Real-time portfolio updates
- Private Discord channels