What’s Next for Inflation? - 03.13.24
OVERVIEW Inflation has significantly influenced market dynamics for the past two years, beginning its sharp rise in early 2021. It wasn't until the end of that year that the Federal Reserve acknowledged the necessity for higher interest rates and the end of qu

OVERVIEW
Inflation has significantly influenced market dynamics for the past two years, beginning its sharp rise in early 2021. It wasn't until the end of that year that the Federal Reserve acknowledged the necessity for higher interest rates and the end of quantitative easing. Since then, we've witnessed inflation peak at over 9% before retracting to the lower 3% range. Amid concerns over the Fed potentially "losing control," fears of a "second wave of inflation," and anxieties regarding national debt and deficits, we aim to demystify these issues, offering our perspectives and tools for ongoing monitoring.
FED’S CURRENT POLICY
Assessing the Federal Reserve's “real policy” level requires more than a glance at the Fed Funds rate. Considering inflation metrics like CPI are lagged, subtracting the latest inflation figures from the Fed Funds rate doesn't provide a clear indication of market expectations for monetary policy. Instead, analyzing forward markets for Fed policy and inflation expectations gives us a more accurate measure of the market's anticipation of "real policy."
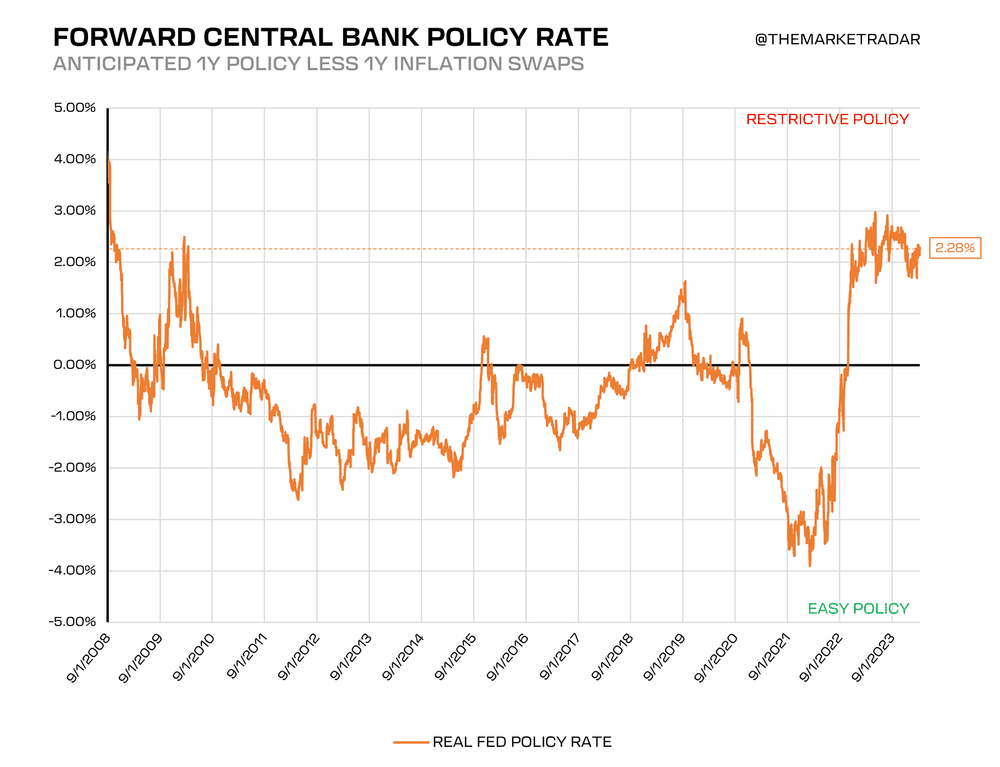
Real policy rates are at their highest level of restrictiveness since 2009, even when considering the three expected rate cuts. Consequently, the market's consensus indicates that, after these rate adjustments and taking into account projected inflation trends, the Federal Reserve's policy stance will remain more than 200 basis points above the inflation rate, thus maintaining a restrictive policy environment. We know markets aren’t efficient and this will change as time goes on. The key here is instead of front-running the market, wait for gradual signals to emerge before throwing chips on the table.
INFLATION
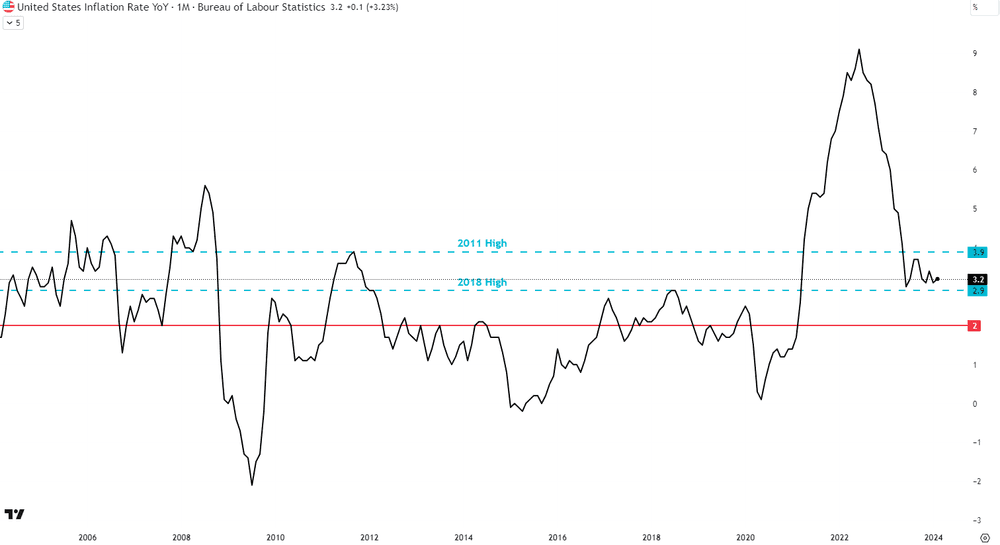
Great progress on inflation has been made over the last 12 months, we’re now 70bps below the 2011 highs and only 30bps over the 2018 highs. When we lay the data out like this, without hyper-focusing on the ridiculous core metrics, we can get a better understanding of the dynamic we’re currently in. That being, the Fed is restrictive and the fight on inflation hasn’t been won just yet and while the disinflation cycle is still in play, there will be hiccups along the way.
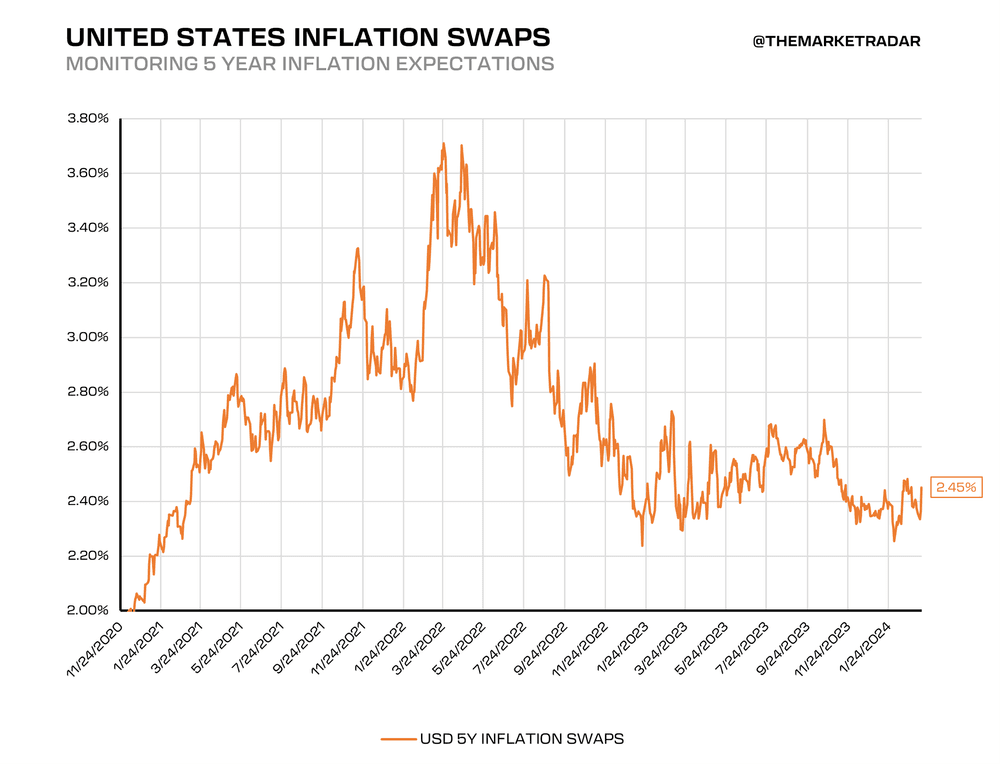
Another angle we can take to get a more balanced view is to go out further in duration. Let’s look at 5Y inflation swaps, what do we see? We see that the market is continuing to see an overall broad base disinflationary force and continues to price that accordingly.
GOVERNMENT SPENDING
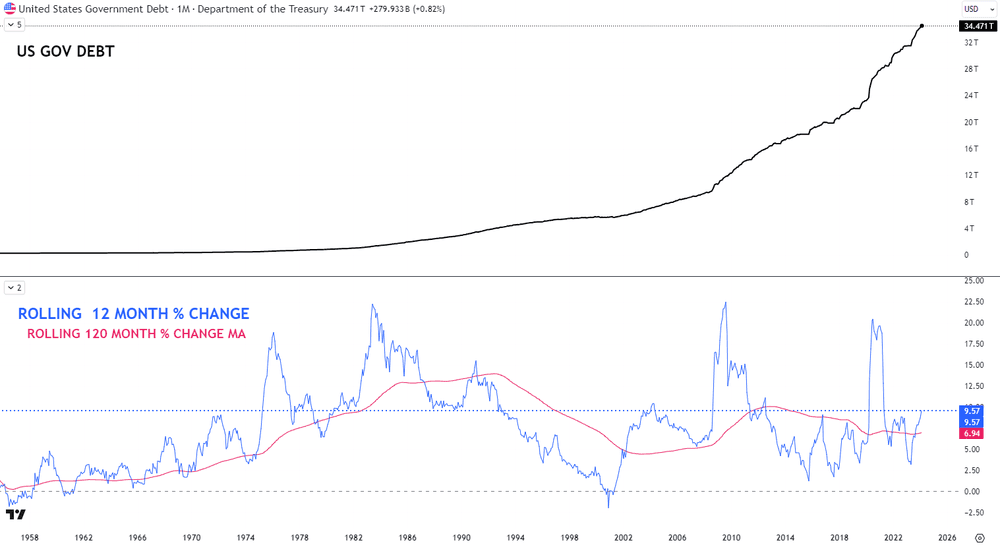
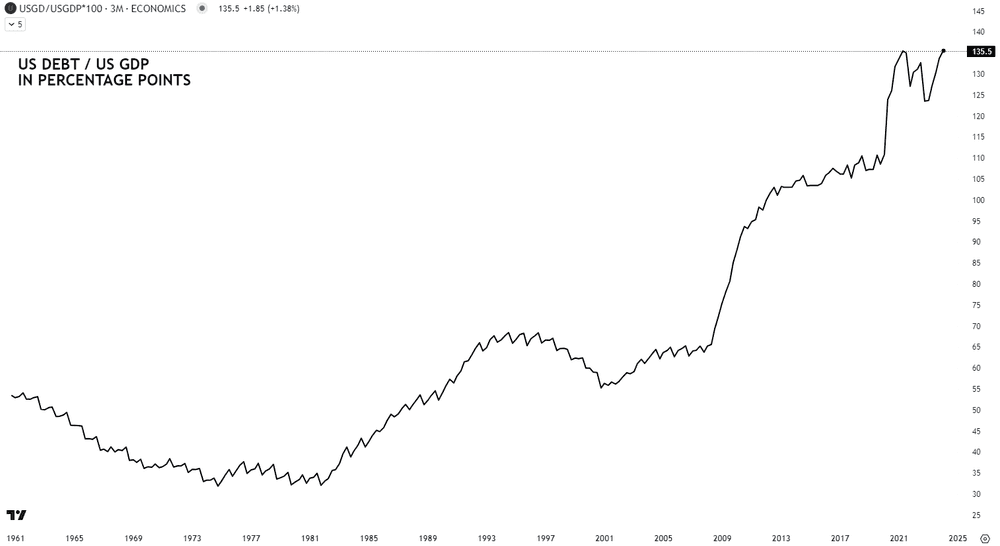
The national debt's $3 trillion increase since the last debt ceiling adjustment has sparked widespread debate. However, when contextualized with historical data, the current rate of debt accumulation is not unprecedented. As you can see here, the rate of change is actually lower than what is was during most of the 80s and 90s. From what I can tell, the issue here is that people are extrapolating debt costs across an unrealistic rate path that will likely look much different after a recession hits.
While this may open some eyes, the major focus tends to gravitate towards the debt-to-GDP ratio, which, despite the nominal debt increase, has stabilized post-pandemic. While on the rise as of late, this doesn’t scream crisis, if anything it does say there’s a problem that needs to be addressed. More on this below.
🚀 Join the Radar Community
Get free access to MacroBase and notifications about new posts and updates.
This metric's significance lies in its implications for future fiscal policy, especially in higher interest rate environments that could constrain government spending and borrowing capabilities. Comparatively, countries like Singapore demonstrate that high debt-to-GDP ratios do not inherently signal economic peril, provided inflation remains managed and economic growth is sustained. While surprisingly, a country like Argentina experienced hyperinflation with a debt-to-GDP ratio peaking barely above 100%. Countries matter, and the currency they issue matters more. Given the status of America, I expect we can see a debt-to-GDP ratio much higher than where we are now and not experience the fate others have felt at much lower figures. Stage 4 of the Compound Landing will likely raise this ratio as deficits accelerate into a recession. My suggestion is to not underestimate what is possible with the credit quality of the United States for as long as it has it. Argentina doesn’t happen overnight.
THE SYSTEM
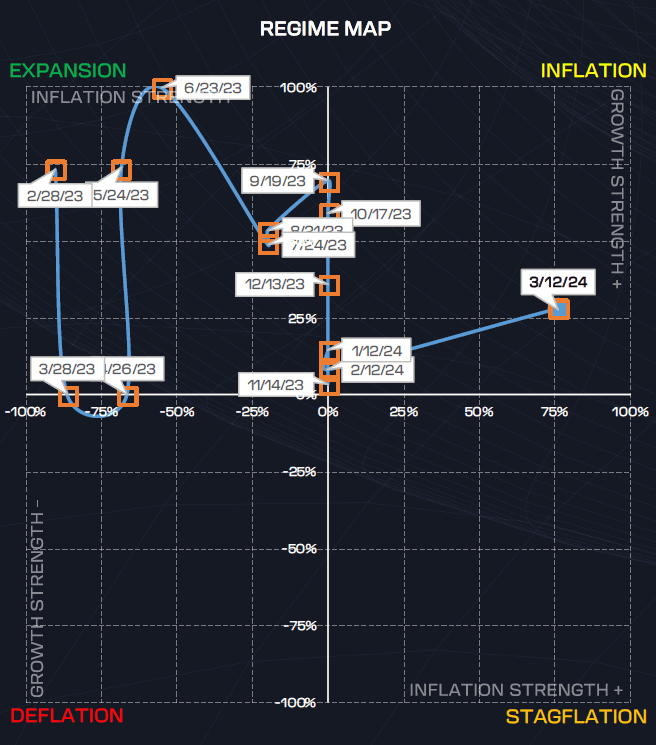
Our System's data reveals robust underlying strength in both our growth and inflation indices, suggesting that inflationary pressures don’t hold the same focal point they did when growth was much weaker. Recently we witnessed a transition from the Expansion to Inflation regime which supports the potential for sustained inflation, albeit within the context of continuing economic growth. This nuanced view emphasizes the importance of distinguishing between economic regimes as stronger inflation readings within growth environments are much different for markets than positive inflation readings, or readings that are “running away higher”, coupled with negative growth environments.
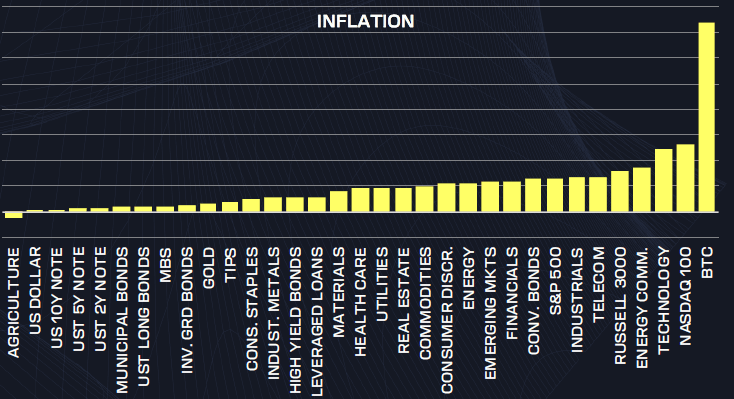
As you can see, the System sees a strong underlying strength score for the inflation index now. You’re probably thinking…well that means inflation is going way higher. So, let’s tackle that first.
Could we see a rebound in inflation? If the System is signaling it, we cannot discount it. What we need to understand though is what the rebound looks like. These readings are strength scores, not directional values. So, we’re looking at a strong inflation strength score, where the economy is growing simultaneously. We may see inflation stick around here as the disinflation cycle continues for some time, which is what we’ve been saying all along, “Inflation is easy to get from 9-5 but hard to get from 5-2”.
Some of you may have heard our verbiage over the last few months regarding commodity prices not having much upside and some of that can be walked back if commodities start aligning WITH the System. So, for example, Crude is now above MOMO, but still bearish trend. If we can flip bullish trend within the current regime, the door opens for higher prices. This goes for a lot of other commodities as well.
We’re certainly more open to the idea of commodities having some upside here if the System AND trends support them if/when they flip. Refer below to the regime chart and you can see the better performers during inflation regimes historically.
We can’t ignore the headwinds here though. You have the Fed against you along with the pause throughout this disinflation cycle might not last as long as anyone expects where we either lose inflation strength and fall back into Expansion, or growth and well and completely shift to Deflation. That would also be a very big driver for Stage 4 of #TheCompoundLanding.
SUMMARY
So, we’ve explored the market’s interpretations of the Fed, and additional perspectives on government spending and debts with what our models are seeing. We remain fluid in the situation. There isn’t a narrative we’ll get caught up in. For those of you who are commodity enthusiasts and are wondering why we don’t long them, here’s the answer:
In Risk-On regimes, you only have 1 regime where they work (Inflation), in Risk-Off regimes, you only have 1 where they MAY work (Stagflation).
Unfortunately, from our analysis, we’ve seen too much evidence of the market drifting too frequently between regimes through a Risk-On or Risk-Off cycle making managing these commodity positions relatively tough and increasing the “stress-per-alpha” beyond what is necessary. Some of you are new to the arena here, and we welcome you, but 2021-2022 was not a normal year, those types of persistent commodity runs do not happen across normal cycles.
We will continue to ride the wave.